
Packaging Machinery Comparison Europe: Cost, Uptime, and Service Risk
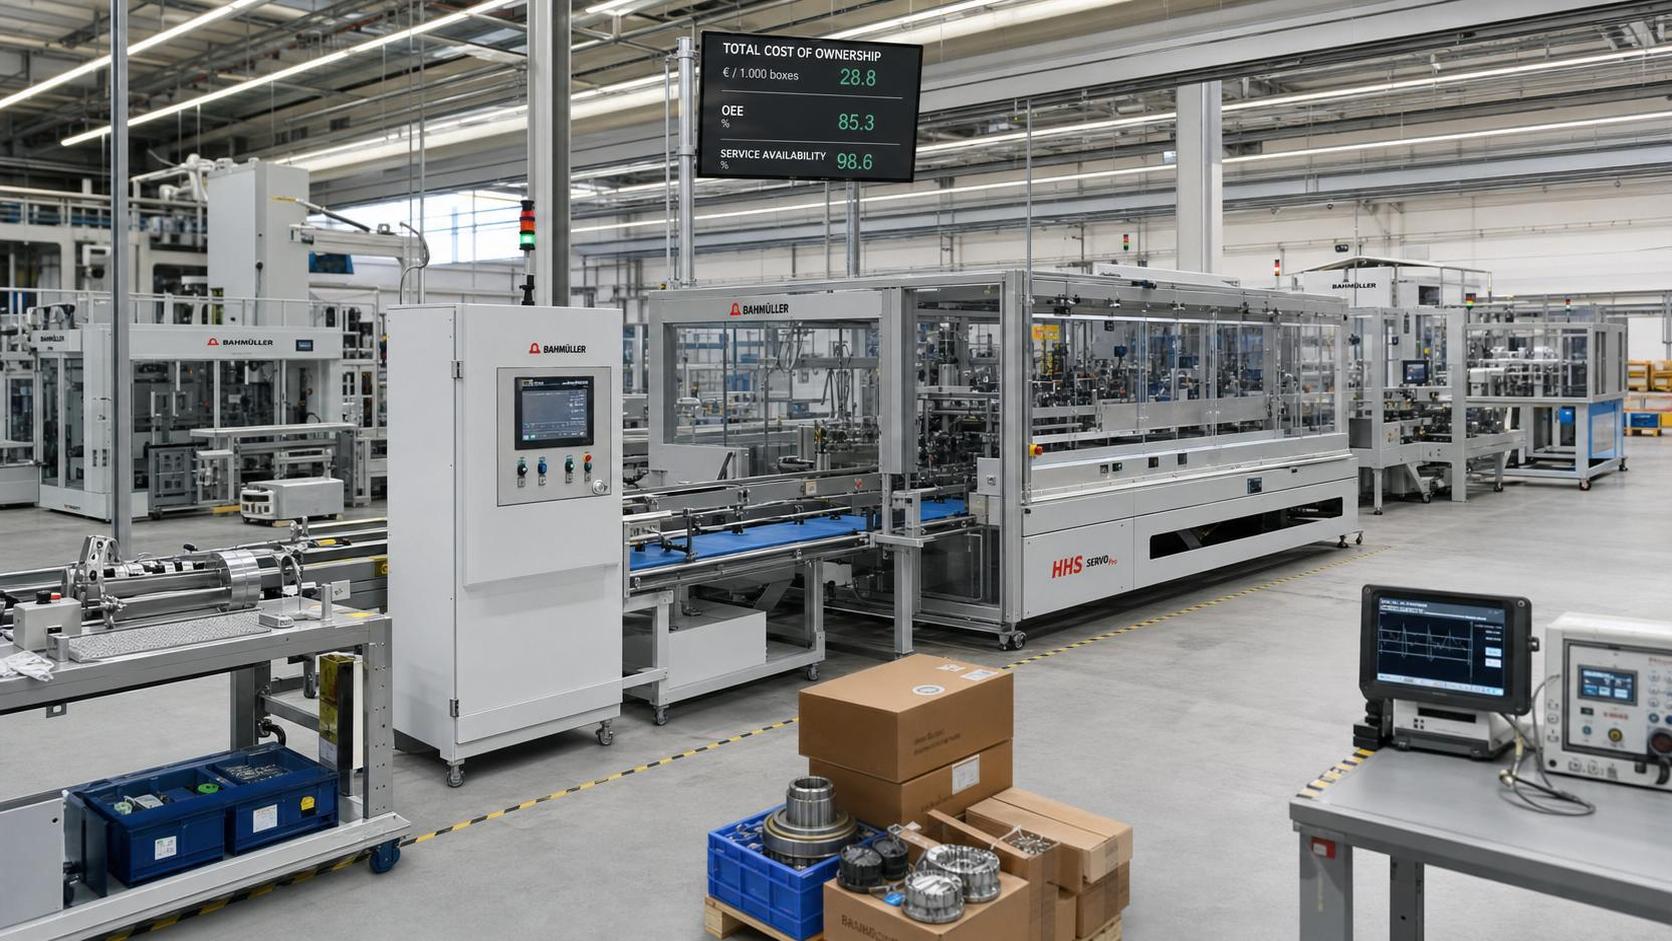
Packaging Machinery Comparison Europe: Cost, Uptime, and Service Risk
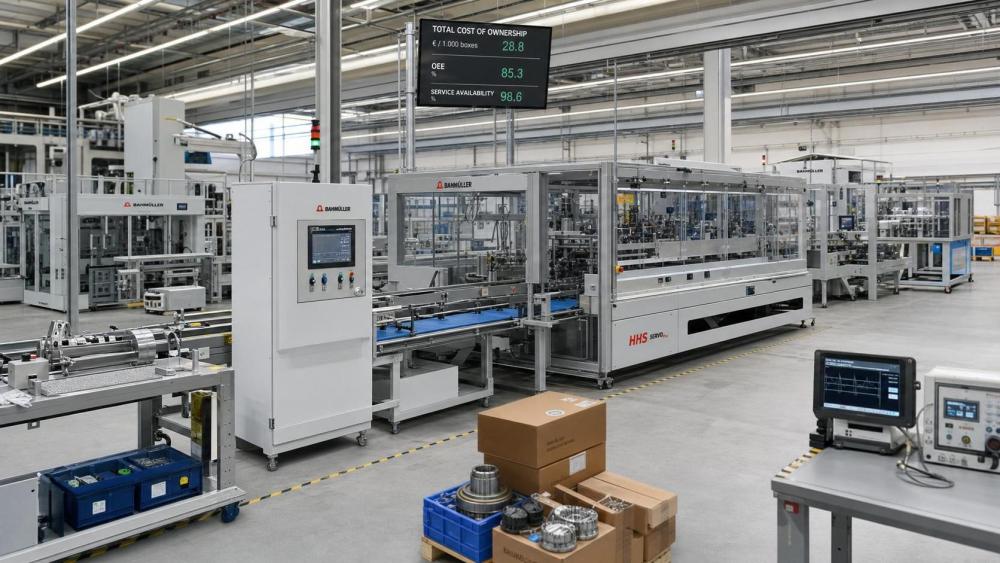
For procurement teams navigating Europe’s packaging equipment market, a smart packaging machinery comparison Europe strategy goes far beyond sticker price.
Real purchasing decisions depend on total cost, uptime stability, service responsiveness, spare-parts access, and long-term operational risk.
This guide helps buyers compare suppliers with a practical lens, reduce ownership cost, and protect production continuity.
In practice, the best machine is rarely the cheapest one on the quotation sheet.
It is the one that fits volume, labor structure, compliance needs, and service realities across European operations.
Why packaging machinery comparison Europe now requires a wider cost view
European packaging plants face pressure from energy prices, labor shortages, traceability rules, and tighter delivery windows.
That changes how a packaging machinery comparison Europe exercise should be built.
A lower purchase price can quickly lose its advantage if setup times are long or local support is weak.
This is even more important in corrugated, folding carton, tissue, and high-mix digital print workflows.
IPPS tracks these shifts closely across digital printing, corrugation, post-press, and automated converting equipment.
The signal is clear: ownership economics matter more than headline pricing.
The cost categories that deserve attention first
A strong packaging machinery comparison Europe model should include direct and hidden costs.
- Machine price, installation, commissioning, and operator training
- Energy consumption, glue or consumables use, and planned maintenance
- Changeover losses, waste rates, and startup scrap
- Spare-parts cost, freight time, and emergency service premiums
- Software licensing, upgrades, and integration with MES or ERP systems
When these items are ignored, the comparison becomes too narrow to support a reliable sourcing decision.
How to compare total cost instead of purchase price alone
A practical packaging machinery comparison Europe process starts with a five-year cost horizon.
Three years can work for fast-changing applications, but five years usually exposes the real cost curve.
This is especially useful for folder gluers, die-cutters, corrugated lines, and digital print systems.
Use a simple total cost framework
- Estimate annual running hours and realistic load factor.
- Apply expected waste, labor, and energy figures.
- Add preventive maintenance and likely corrective repairs.
- Price spare-parts baskets for one, three, and five years.
- Quantify lost output from downtime using contribution margin.
This approach makes packaging machinery comparison Europe more commercial and less emotional.
It also helps align engineering, finance, and operations around one shared model.
Sample comparison table for buyer discussions
Uptime is often the deciding factor in packaging machinery comparison Europe
From recent market changes, uptime has become one of the strongest decision drivers.
European converters increasingly run shorter orders, tighter schedules, and mixed packaging formats.
That means downtime costs are no longer occasional. They are recurring operational losses.
What uptime should really mean during evaluation
Suppliers often present uptime differently, so comparisons need tighter definitions.
- Ask whether uptime excludes planned maintenance.
- Check if data comes from similar applications and output speeds.
- Review fault history for feeders, drives, sensors, and glue systems.
- Request references using similar board grades or print substrates.
A credible packaging machinery comparison Europe review uses verified operating data, not just brochure claims.
Where uptime risk usually hides
The more obvious signal is that many failures come from interfaces, not only core mechanics.
Examples include unstable web tension, inconsistent board quality, poor HMI design, and weak line integration.
For digital print and corrugated operations, these issues can cascade into waste, rework, and missed delivery slots.
Service risk can reshape the final buying decision
A sound packaging machinery comparison Europe process always measures service depth, not only service promises.
This matters because service weakness usually appears after installation, when switching costs are highest.
In real operations, the difference between remote guidance and a same-day field technician is huge.
Questions that reveal service capability
- How many factory-trained technicians are based in Europe?
- What is the guaranteed response time by country?
- Which parts are stocked locally, and which ship from overseas?
- Are diagnostic tools available for remote troubleshooting?
- Is operator retraining included after staff turnover?
These questions make packaging machinery comparison Europe more useful for risk control.
Spare-parts availability deserves separate scoring
Parts availability should never be buried inside general service discussions.
A low-cost machine with poor parts logistics may become the highest-risk asset on the floor.
This is especially true for servo modules, printheads, control boards, and precision gluing components.
A practical scoring model for supplier selection
One effective packaging machinery comparison Europe method is a weighted scorecard.
It keeps decision-making transparent when several departments influence the purchase.
Suggested weighting structure
- Total cost of ownership: 30%
- Uptime and technical reliability: 25%
- Service network and parts access: 20%
- Application fit and throughput: 15%
- Compliance, digital readiness, and reporting: 10%
The exact weights can change, but the structure is robust across most packaging equipment categories.
This also creates cleaner internal approval discussions with finance and operations leaders.
Do not skip factory reference checks
A site visit often reveals what quotations cannot.
Watch actual setup time, operator workload, maintenance access, and cleaning effort.
For an accurate packaging machinery comparison Europe review, ask users what happened after the first year.
What stronger procurement decisions usually look like
Better decisions tend to share the same pattern.
They compare cost, uptime, and service risk in one framework, not in separate conversations.
They also connect machine choice with broader packaging strategy, labor reality, and sustainability targets.
That is where packaging machinery comparison Europe becomes a business tool instead of a basic vendor check.
For teams evaluating digital printing systems, corrugated lines, die-cutters, folder gluers, or tissue equipment, the same principle holds.
Look beyond price, stress-test uptime assumptions, and verify service infrastructure before final award.
That final discipline usually protects margin better than any initial discount.
Industry Briefing
Get the top 5 industry headlines delivered to your inbox every morning.
Recommended News